The Eco Shell Marathon
This year, I am a member of the Eco Motion Team, which participates annually in the Shell Marathon organized by the company of the same name. This demanding European competition challenges students to design, build, and drive ultra-efficient vehicles in terms of energy consumption. Polytech Nancy has been participating in this event for 25 years, with over 400 engineering students having taken part, often breaking numerous records. This year, I had the opportunity to join the team as a member of the continuous improvement group. My project involved designing and optimizing the dashboard of our competition vehicle, the “PolyWatt.”
My Project
My project is divided into two main parts. The first part involves designing a Joule meter to collect various vehicle data, such as battery voltage, energy consumption, speed, and remaining laps. This data is sent via optical fiber to the dashboard, which represents the second part of my project. The dashboard is an Android application mounted on a 3D-printed frame on the vehicle’s dashboard. Programmed in Java and XML, this application allows the driver to monitor various indicators to optimize their runs and improve race times. It also provides precise vehicle speed by connecting to around twenty satellites simultaneously.
Additionally, the application sends the vehicle’s consumption data to the EMT website via WebSockets. This data is transmitted from the phone’s USB-C port using optical fiber to ensure no data loss and high transmission speed. The data received on the website is used by the team to strategize and simulate different runs. The application also provides the exact vehicle position during the race. The Joule meter is based on an ESP32 Lolin Lite with exceptional computational speed and an external ADC for precise measurement of battery voltage and current. Using this data, the vehicle’s power consumption is calculated.
Additional Web Development
In addition to the dashboard project, I developed a full-stack website using HTML, CSS, PHP, and JavaScript. The website is divided into two pages: the login page and the main page. The login page allows users to log in with an identifier and password, using session cookies to keep the user logged in.
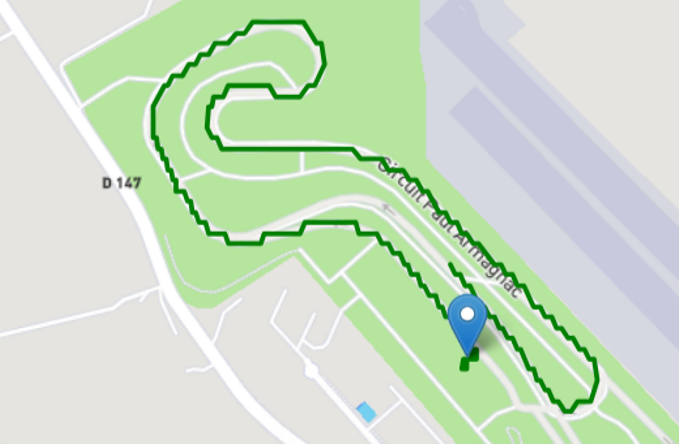
The main page enables the team to select race logs to replay and analyze past data, optimizing future tests and tracking our progress. It also allows live race tracking by checking the “Refresh” box, which updates the car’s path display on the Leaflet map. The refresh interval for simulation points of past races can also be adjusted. Additionally, a table on this page gathers selected log data, including consumption, GPS data, and times at various points, sortable by any of these metrics.
The Android application sends data points associated with logs to the website via HTTP requests. I also designed the MySQL database after creating an entity-relationship diagram and translating it into SQL. I imported Excel files of past races from an old database, converted them into SQL queries using a Python script, and executed them on the new database.
Conclusion
This project allowed me to showcase my expertise in electrical engineering for data transmission and Joule meter design, as well as my skills in Android application development and networking for ensuring proper data transmission to the website. Additionally, it highlighted my abilities in 3D design, as I also designed the dashboard mount and the printed circuit boards for the Joule meter.
